
TMa
The finest reading.
Fruit Merge Analysis the Code
The following code will analyze data collected from the game Fruit Merge.
The game Fruit Merge is something in between Tetris and 2048, the goal is to merge fruit which subsequently becomes the next fruit, e.g. blueberry+blueberry gives a lemon. The fruits’ nicknames (letters) are given according to the Czech language:
- T = třešeň (cherry)
- B = borůvka (blueberry)
- C = citron (lemon)
- H = hrozny (grapes)
- P = pomeranč (orange)
The data is written into CSV file, each game has its own columns. Analyzing: 1) Histogram of the whole game (all the data at once) 2) Histogram of each game 3) Finding how frequent are two-same-letter combinations per game 4) Finding if and how frequent the following combinations are (TTB, BBC, CCH, HHP, BTT, CBB, HCC, PHH)
Despite the fact, that this project was created to analyze the game Fruit Merge (because I was suspicious that the game sends certain fruit combinations), it can be used for any other letter-based data to find certain combinations, e.g. DNA! DNA is basically letter-based data, that can be analyzed to find certain codons.
I am not an experienced coder ad it shows. Each of my code is thoughtfully commented, sometimes there are too many comments.
Manual analysis
The following code is a manual way of working with the data. It is useful if you want to evaluate exactly one game and not the whole CSV dataset.
import pandas as pd
import matplotlib.pyplot as plt


# This part can be useful to evaluate one particular game and not all of them
# loading data as "df"
df = pd.read_csv('fruit_record.csv', sep =";")
# data are separated with ";" ==> sep = ";"
# data include header

# show the head
#print(df.head())
# each game has its own column
# indexing automatically columns and rows starting with 0

# show the tail
#print(df.tail())
# missing data are filled up with NaN, each game is different

# indexing to see the max row number (in case of need)
#print(df.index)
# currently start = 0, stop = 297

#  DataFrame.columns:
#print(df.columns)
# currently start = 0, stop 4

#quick statistics
#print("\n", df.describe())
# is not useful, doesn't show statistics for each letter
# shows how many letters (unique = 5), the most common (top), and how often (freq)
# .count() only counts overall number of elements, not specific

# selecting one column
df_game1 = df["GAME 1"]
#print(df_game1,"\n")
#print("\n",df_game1.count())
#print("\n",df_game1.describe())
df_game2 = df["GAME 2"]
df_game3 = df["GAME 3"]
df_game4 = df["GAME 4"]

print()

"Part 1: Histograms"

# counting number of each letter in each game
print("GAME 1:\n",df_game1.value_counts(), end= "\n\n")
print("GAME 2:\n",df_game2.value_counts(), end= "\n\n")
print("GAME 3:\n",df_game3.value_counts(), end= "\n\n")
print("GAME 4:\n",df_game4.value_counts(), end= "\n\n")

#counting in all games
all_games = df[["GAME 1","GAME 2", "GAME 3", "GAME 4"]].value_counts()
# this counts across the rows

# Viewing the histograms where all the games are evaluated
# melt creates two columns
df_m = df.melt(var_name='columns', value_name='fruit')
print(df_m["fruit"].value_counts(), end = "\n\n")
# plot of value_count, all games (ag)
df_ag = df_m["fruit"].value_counts()
plt.figure("All games fruit count")
df_ag.plot(kind='bar')

# histograms for each game
plt.figure()
df_game1.value_counts().plot(kind='bar')
plt.figure()
df_game2.value_counts().plot(kind='bar')
plt.figure()
df_game3.value_counts().plot(kind='bar')
plt.figure()
df_game4.value_counts().plot(kind='bar')

plt.show()


"Part 2: Looking for patterns"

"Game 1"

print("GAME 1 \n\nPair finding")

# this search is "first" and "then", that means that in 49 cases we can say that the next fruit is going to be the same
# starting if zero pairs
number_of_pairs = 0
number_of_T_pairs = 0
number_of_B_pairs = 0
number_of_C_pairs = 0
number_of_H_pairs = 0
number_of_P_pairs = 0
n_T = 0
n_B = 0
n_C = 0
n_H = 0
n_P = 0
for position in range(1,len(df_game1)):
    # finding if the letters match
    if df_game1.loc[position] == "T":
        n_T += 1
    if df_game1.loc[position] == "B":
        n_B += 1
    if df_game1.loc[position] == "C":
        n_C += 1
    if df_game1.loc[position] == "H":
        n_H += 1
    if df_game1.loc[position] == "P":
        n_P += 1
    if df_game1.loc[position-1] == df_game1.loc[position]:
        #print(f"Tady je dvojice: {position}")
        #if they do, +1
        number_of_pairs += 1
        # if it was T, +1 for T-pairs
        if df_game1.loc[position] == "T":
            number_of_T_pairs += 1
        elif df_game1.loc[position] == "B":
            number_of_B_pairs += 1
        elif df_game1.loc[position] == "C":
            number_of_C_pairs += 1
        elif df_game1.loc[position] == "H":
            number_of_H_pairs += 1
        elif df_game1.loc[position] == "P":
            number_of_P_pairs += 1
print(f"Number of pairs: {number_of_pairs}")
print(f"number of pairs per thrown fruit {number_of_pairs}/{len(df_game1)}")
print(f"Number of T pairs: {number_of_T_pairs}, per T: {number_of_T_pairs}/{n_T}, per thrown fruit: {number_of_T_pairs}/{len(df_game1)}")
print(f"Number of B pairs: {number_of_B_pairs}, per B: {number_of_B_pairs}/{n_B}, per thrown fruit: {number_of_B_pairs}/{len(df_game1)}")
print(f"Number of C pairs: {number_of_C_pairs}, per C: {number_of_C_pairs}/{n_C}, per thrown fruit: {number_of_C_pairs}/{len(df_game1)}")
print(f"Number of H pairs: {number_of_H_pairs}, per H: {number_of_H_pairs}/{n_H}, per thrown fruit: {number_of_H_pairs}/{len(df_game1)}")
print(f"Number of P pairs: {number_of_P_pairs}, per P: {number_of_P_pairs}/{n_P}, per thrown fruit: {number_of_P_pairs}/{len(df_game1)}")


print("\n")

print("Finding subsequent fruit")
"The following section is to find subsequent fruit."
"Because T+T gives B, the aim is to find TTB, BBC, CCH, HHP."

n_TTB = 0
n_BBC = 0
n_CCH = 0
n_HHP = 0
for position in range(2,len(df_game1)):
    if df_game1.loc[position-2] == df_game1.loc[position-1]:
        if df_game1.loc[position-2] == "T":
            if df_game1.loc[position] == "B":
                n_TTB += 1
        if df_game1.loc[position-2] == "B":
            if df_game1.loc[position] == "C":
                n_BBC += 1
        if df_game1.loc[position-2] == "C":
            if df_game1.loc[position] == "H":
                n_CCH += 1
        if df_game1.loc[position-2] == "H":
            if df_game1.loc[position] == "P":
                n_HHP += 1
print(f"Number of combinations per thrown fruit: {n_TTB+n_BBC+n_CCH+n_HHP}/{len(df_game1)}")
print(f"Number of TTB: {n_TTB}, per T: {n_TTB}/{n_T}, per thrown fruit: {n_TTB}/{len(df_game1)}")
print(f"Number of BBC: {n_BBC}, per B: {n_BBC}/{n_B}, per thrown fruit: {n_BBC}/{len(df_game1)}")
print(f"Number of CCH: {n_CCH}, per C: {n_CCH}/{n_C}, per thrown fruit: {n_CCH}/{len(df_game1)}")
print(f"Number of HHP: {n_HHP}, per H: {n_HHP}/{n_H}, per thrown fruit: {n_HHP}/{len(df_game1)}")

print("\n")

print("Finding previous fruit")
"The following section is to find previous fruit. Because T+T gives B, the aim is to find BTT, CBB, HCC, PHH."
n_BTT = 0
n_CBB = 0
n_HCC = 0
n_PHH = 0
for position in range(2,len(df_game1)):
    if df_game1.loc[position-1] == df_game1.loc[position]:
        #print(f"Tady je dvojice: {position}")
        if df_game1.loc[position-1] == "T":
            if df_game1.loc[position-2] == "B":
                n_BTT += 1
        if df_game1.loc[position-1] == "B":
            if df_game1.loc[position-2] == "C":
                n_CBB += 1
        if df_game1.loc[position-1] == "C":
            if df_game1.loc[position-2] == "H":
                n_HCC += 1
        if df_game1.loc[position-1] == "H":
            if df_game1.loc[position-2] == "P":
                n_PHH += 1
print(f"Number of combinations per thrown fruit: {n_BTT+n_CBB+n_HCC+n_PHH}/{len(df_game1)}")
print(f"Number of BTT: {n_BTT}, per B: {n_BTT}/{n_B}, per thrown fruit: {n_BTT}/{len(df_game1)}")
print(f"Number of CBB: {n_CBB}, per C: {n_CBB}/{n_C}, per thrown fruit: {n_CBB}/{len(df_game1)}")
print(f"Number of HCC: {n_HCC}, per H: {n_HCC}/{n_H}, per thrown fruit: {n_HCC}/{len(df_game1)}")
print(f"Number of PHH: {n_PHH}, per P: {n_PHH}/{n_P}, per thrown fruit: {n_PHH}/{len(df_game1)}")

print("\n")

print(f"Number of ALL combinations per thrown fruit: {n_BTT+n_CBB+n_HCC+n_PHH+n_TTB+n_BBC+n_CCH+n_HHP}/{len(df_game1)}")
Results
GAME 1
Pair finding Number of pairs: 49 number of pairs per thrown fruit 49/297 Number of T pairs: 10, per T: 10/53, per thrown fruit: 10/297 Number of B pairs: 12, per B: 12/62, per thrown fruit: 12/297 Number of C pairs: 10, per C: 10/59, per thrown fruit: 10/297 Number of H pairs: 10, per H: 10/64, per thrown fruit: 10/297 Number of P pairs: 7, per P: 7/58, per thrown fruit: 7/297
Finding subsequent fruit Number of combinations per thrown fruit: 11/297 Number of TTB: 2, per T: 2/53, per thrown fruit: 2/297 Number of BBC: 4, per B: 4/62, per thrown fruit: 4/297 Number of CCH: 5, per C: 5/59, per thrown fruit: 5/297 Number of HHP: 0, per H: 0/64, per thrown fruit: 0/297
Finding previous fruit Number of combinations per thrown fruit: 12/297 Number of BTT: 2, per B: 2/62, per thrown fruit: 2/297 Number of CBB: 2, per C: 2/59, per thrown fruit: 2/297 Number of HCC: 4, per H: 4/64, per thrown fruit: 4/297 Number of PHH: 4, per P: 4/58, per thrown fruit: 4/297
Number of ALL combinations per thrown fruit: 23/297
Discussion
Despite my big hopes, it seems that the useful combinations from above come only rarely, and I cannot hack the game as I hoped.
Automated code for a complete analysis
The following code does the same thing, but it does so automatically. It analyzes the whole package, all the data at once. If you have little data, then there is no problem. But if you have more than 10 games recorded (more than 10 columns), then it might heat up your computer a bit.
import pandas as pd
import matplotlib.pyplot as plt

def load_data(file):
    # loading the CSV data using pandas (DataFrame)
    return pd.read_csv(file, sep=";")

def quick_data(df):
    # display basic information about the data
    print("\nHead of the data: \n",df.head())
    print("\nTail of the data: \n",df.tail())
    print("\nDescribe the data: \n",df.describe())

def count_fruit_per_game(df,column):
    # count the number of each fruit in a game
    print("\n")
    print(f"{column}:\n", df[column].value_counts(), "\n")
    return df[column].value_counts()

def histogram(df,columns):
    # one histogram for all games (to see if all fruit is equally thrown)
    # melt creates two columns
    df_melted = df.melt(var_name='Game', value_name='Fruit')
    fruit_counts = df_melted['Fruit'].value_counts()

    # histogram for all games at once
    plt.figure("All games fruit count")
    fruit_counts.plot(kind='bar', color = "purple")

    #Histograms for each game
    for column in columns:
        plt.figure(f"{column} fruit count")
        df[column].value_counts().plot(kind='bar', color = "red")

    plt.show()

"""
Alternativelly, to order the fruit from the smallest to the biggest
def histogram(df, columns):
    # Definice požadovaného pořadí ovoce
    fruit_order = ["T", "B", "C", "H", "P"]

    # Histogram pro všechny hry dohromady
    df_melted = df.melt(var_name="Game", value_name="Fruit")
    fruit_counts = df_melted["Fruit"].value_counts().reindex(fruit_order, fill_value=0)

    plt.figure("All games fruit count")
    fruit_counts.plot(kind="bar", color="purple")

    # Histogramy pro jednotlivé hry
    for column in columns:
        plt.figure(f"{column} fruit count")
        game_counts = df[column].value_counts().reindex(fruit_order, fill_value=0)
        game_counts.plot(kind="bar", color="red")

    plt.show()
"""

def find_fruit_pairs(df, column):
    #finding if and how frequent two-same-letter combinations are in a game (pairs)
    game_data = df[column]
    total_pairs = 0
    # counting using a dictionary
    fruit_pair_counts = {"T": 0, "B": 0, "C": 0, "H": 0, "P": 0}
    fruit_counts = {"T": 0, "B": 0, "C": 0, "H": 0, "P": 0}

    for i in range(1, len(game_data)):
        current_fruit = game_data.loc[i]
        previous_fruit = game_data.loc[i-1]

        # stop processing if any value is NaN (each game is different, different amount of thrown fruit)
        if pd.isna(current_fruit) or pd.isna(previous_fruit):
            break

        # counting individual fruit
        if current_fruit in fruit_counts:
            fruit_counts[current_fruit] += 1

        # Check if fruits are the same (forming a pair)
        if current_fruit == previous_fruit:
            total_pairs += 1
            if current_fruit in fruit_pair_counts:
                fruit_pair_counts[current_fruit] += 1

    # Displaying the results
    print(f"\nGame: {column}")
    print(f"Total pairs: {total_pairs}")

    total_fruits_thrown = len(game_data.dropna())  # Only consider non-NaN fruits

    # showing counts and frequencies for each fruit
    for fruit, count in fruit_pair_counts.items():
        fruit_total = fruit_counts[fruit]
        if fruit_total > 0:
            per_fruit = f"{count}/{fruit_total}"
        else:
            per_fruit = "N/A"
        per_total_thrown = f"{count}/{total_fruits_thrown}"

        print(f"{fruit} pairs: {count}, per {fruit}: {per_fruit}, per total thrown: {per_total_thrown}")

    return fruit_pair_counts, total_pairs

def find_combinations(df, column, patterns):
    # finding specific combinations in the game
    game_data = df[column]
    pattern_counts = {pattern: 0 for pattern in patterns}

    for i in range(2, len(game_data)):
        first_fruit = game_data.loc[i-2]
        second_fruit = game_data.loc[i-1]
        third_fruit = game_data.loc[i]

        # stop the processing if any value is NaN
        if pd.isna(first_fruit) or pd.isna(second_fruit) or pd.isna(third_fruit):
            break

        # transposing the data into string in case I made a mistake, or someone else who would use this
        first_fruit = str(first_fruit)
        second_fruit = str(second_fruit)
        third_fruit = str(third_fruit)

        # finding the combinations (TTB, BBC, CCH, HHP)
        combination = first_fruit + second_fruit + third_fruit
        if combination in pattern_counts:
            pattern_counts[combination] += 1

    # showing results
    print(f"\nGame: {column} - Pattern counts")
    for pattern, count in pattern_counts.items():
        print(f"{pattern}: {count}")

    return pattern_counts

def analyze_all_games(df):
    #everything combined
    columns = df.columns
    patterns_subsequent = ["TTB", "BBC", "CCH", "HHP"]
    patterns_previous = ["BTT", "CBB", "HCC", "PHH"]

    # Part 1: Count fruit and plot histograms
    for column in columns:
        count_fruit_per_game(df, column)

    histogram(df, columns)

    # Part 2: Find pairs and combinations for each game
    for column in columns:
        print(f"\nAnalyzing {column}:")
        find_fruit_pairs(df, column)
        find_combinations(df, column, patterns_subsequent)
        find_combinations(df, column, patterns_previous)

file = 'fruit_record.csv'
df = load_data(file)
quick_data(df)
analyze_all_games(df)
Results
Analyzing GAME 1
Total pairs: 49
T pairs: 10, per T: 10/53, per total thrown: 10/297
B pairs: 12, per B: 12/62, per total thrown: 12/297
C pairs: 10, per C: 10/59, per total thrown: 10/297
H pairs: 10, per H: 10/64, per total thrown: 10/297
P pairs: 7, per P: 7/58, per total thrown: 7/297
Pattern counts
TTB: 2
BBC: 4
CCH: 5
HHP: 0
Pattern counts
BTT: 2
CBB: 2
HCC: 4
PHH: 4
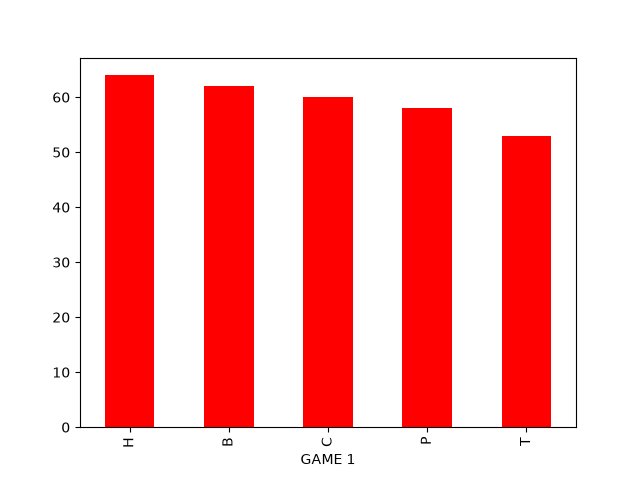 Histogram Game 1
Analyzing GAME 2
Total pairs: 34
T pairs: 3, per T: 3/29, per total thrown: 3/206
B pairs: 7, per B: 7/48, per total thrown: 7/206
C pairs: 7, per C: 7/38, per total thrown: 7/206
H pairs: 8, per H: 8/54, per total thrown: 8/206
P pairs: 9, per P: 9/36, per total thrown: 9/206
Pattern counts
TTB: 2
BBC: 1
CCH: 2
HHP: 0
Pattern counts
BTT: 0
CBB: 1
HCC: 2
PHH: 2
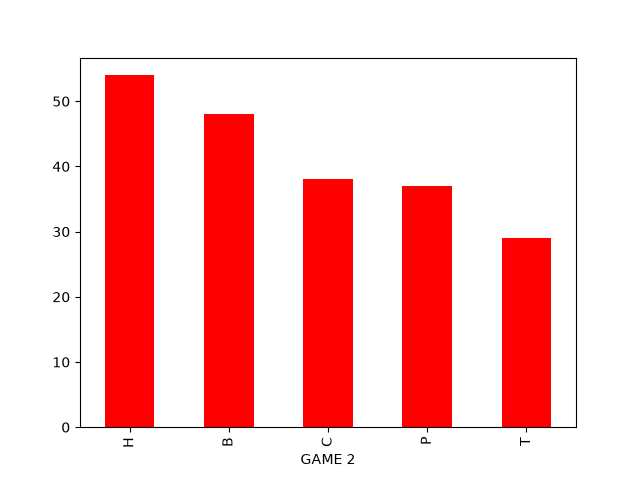 Histogram Game 2
Analyzing GAME 3
Total pairs: 34
T pairs: 9, per T: 9/46, per total thrown: 9/204
B pairs: 5, per B: 5/35, per total thrown: 5/204
C pairs: 8, per C: 8/38, per total thrown: 8/204
H pairs: 10, per H: 10/49, per total thrown: 10/204
P pairs: 2, per P: 2/35, per total thrown: 2/204
Pattern counts
TTB: 4
BBC: 1
CCH: 5
HHP: 2
Pattern counts
BTT: 1
CBB: 2
HCC: 1
PHH: 3
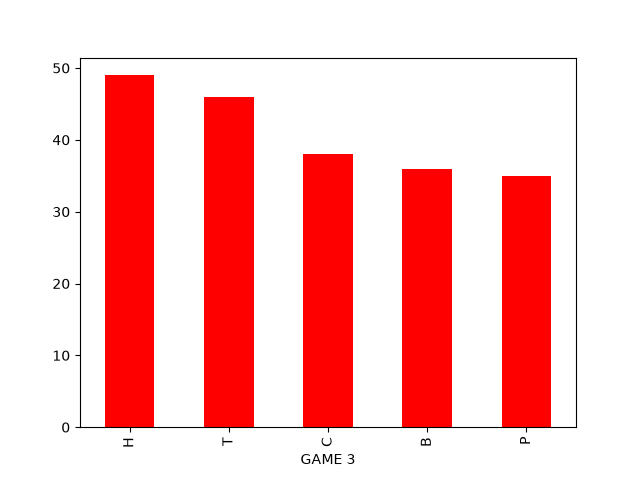 Histogram Game 3
Analyzing GAME 4
Total pairs: 40
T pairs: 4, per T: 4/31, per total thrown: 4/237
B pairs: 8, per B: 8/48, per total thrown: 8/237
C pairs: 9, per C: 9/58, per total thrown: 9/237
H pairs: 15, per H: 15/65, per total thrown: 15/237
P pairs: 4, per P: 4/34, per total thrown: 4/237
Pattern counts
TTB: 1
BBC: 2
CCH: 4
HHP: 0
Pattern counts
BTT: 1
CBB: 5
HCC: 3
PHH: 3
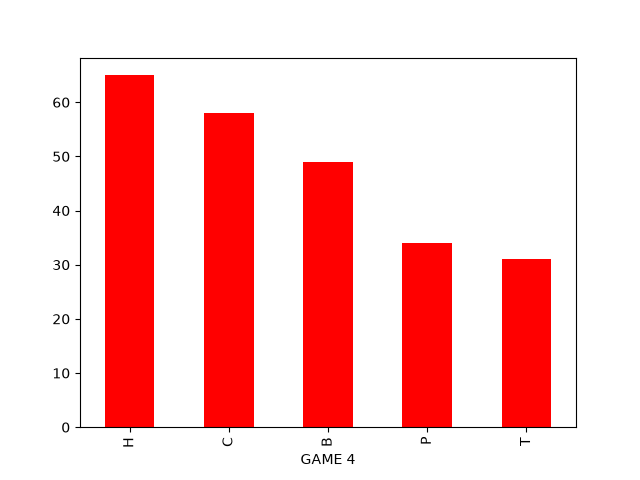 Histogram Game 4
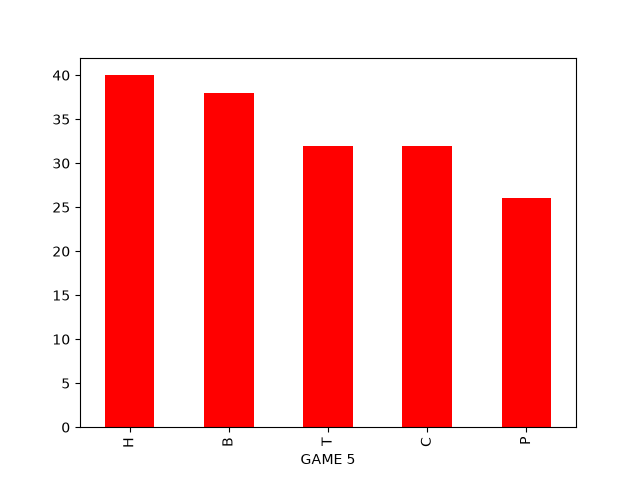
Analyzing GAME 5:
Game: GAME 5
Total pairs: 24
T pairs: 5, per T: 5/32, per total thrown: 5/168
B pairs: 8, per B: 8/37, per total thrown: 8/168
C pairs: 1, per C: 1/32, per total thrown: 1/168
H pairs: 6, per H: 6/40, per total thrown: 6/168
P pairs: 4, per P: 4/26, per total thrown: 4/168
Pattern counts
TTB: 1
BBC: 0
CCH: 0
HHP: 0
Pattern counts
BTT: 0
CBB: 1
HCC: 1
PHH: 1
 Histogram Game 5
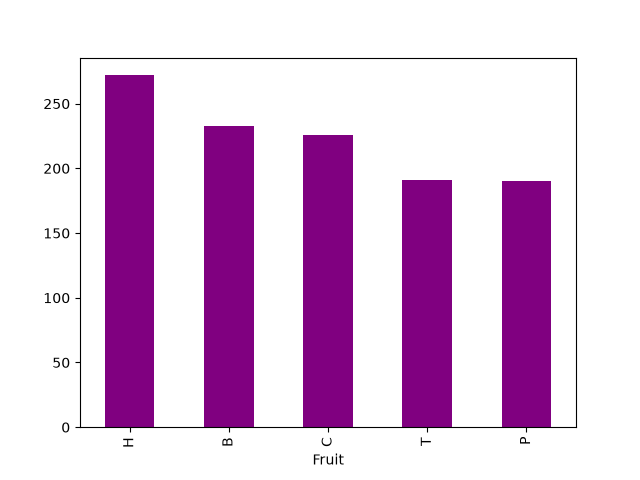
All games
 Histogram All Games
Discussion
Given the results, it is not possible to say, that one can predict or rely on useful combinations in the game. However, given the histograms for each game, we can see a clear trend. Hrozny (=grapes) are thrown the most. This applies for each game and even when the data are combined. This is an interesting finding as hrozny are penultimate biggest fruit thrown.
Interestingly, the results from Game 1 and Game 4 are very different. While in the former case it is possible to say, that the fruit is thrown almost uniformly, in the latter case the difference between the most (Hrozny) and least (Třešně) thrown fruit is almost double. This could indicate, that the longer the game is, the more uniform the distribution is. The shortest game was the Game 5 and it is more uniform than Game 4.
The fact that the least thrown fruit is usually Třešně (=cherry) or Pomeranč (=orange) could imply that either is thrown based on how successful the game is. If the player manages to get bigger fruits, Pomeranče are thrown more often, whereas if the game is not successful, Třešně are thrown more often. However, the relationship between fruit thrown and fruit in the basket was not studied.
Based on the data for all games it appears that neither extreme, Třešně or Pomeranče.