
Tibor
Já a můj blog.
One-Dimensional Diffusion–Reaction Modeling of Lactose Hydrolysis in a Porous Membrane
1. Task
In a membrane reactor, a reactive species diffuses through a semi-permeable membrane where a first-order reaction occurs. Concentration changes along the membrane thickness, and permeability may depend on temperature. Develop a 1D coupled mass diffusion-reaction model using the Finite Volume Method (FVM) that predicts concentration decay across the membrane. Evaluate the effect of reaction rate constants and membrane thickness on conversion.
2. Problem Description
I decided to model the removal of lactose from milk using a membrane loaded with an enzyme that breaks it down to galactose and glucose. Milk is ultra-filtered with a porous membrane made out of polyethersulfone (PES), and the enzyme used is a lactase (-galactosidase) from Aspergillus Oryzae. Therefore, the concentration of lactose will be modeled across the membrane.
3. Calculations
First, let us assume that the process is iso-thermic, which is a valid estimation as enzymes may degrade as the temperature increases. Second, only diffusion and first order reaction will be assumed in only one dimension. Finally, only the concentration of lactose in the membrane will be modeled.
Governing Equations
The partial differential equation for this system is:
According to the literature, milk contains about g/L of lactose. The diffusivity of lactose is approximated with lactose’s diffusivity in water at 25 °C for 0.1 mol/L concentration m2/s. The enzymatic reaction rate is described with Michaelis-Menten law,
The enzymatic reaction rate is described by the Michaelis-Menten law:
Where:
- : Maximum reaction velocity.
- : Substrate concentration.
- : Michaelis constant, defined as the substrate concentration at which the reaction rate reaches one half of .
If the substrate concentration is significantly lower than , it can be approximated with first-order kinetics:
If the substrate concentration is significantly lower than , it can be approximated with first-order reaction kinetics, where the rate constant equals to:
The values of the constants were obtained from literature. mM, mM/min/mg-enzyme. Although the bulk lactose concentration is higher than the Michaelis constant, diffusion limitations inside the porous membrane lead to much lower local substrate concentrations at the enzyme sites. Therefore, the first-order kinetics used in this model represents an effective reaction rate within the porous membrane rather than intrinsic enzyme kinetics.
The loading of enzyme was based on literature for a different system, about 0.2 mg-enzyme/cm3-polymer. However, given the porous medium, the reaction rate constant is lower due to inaccessibility of the substrate to the enzyme. Due to lack of experimental data for the aforementioned system, the reaction rate was estimated to be 100 times lower. Finally, the thickness of the membrane is usually about 150 µm having length of 1 m and width of 0.5 m.
Boundary and Initial Conditions
The initial condition
and boundary condition
were chosen.
Given it is a 2nd order partial differential equation, two boundary conditions are necessary. At the membrane outlet, a Dirichlet boundary condition
would represent an ideal sink and would unrealistically overestimate conversion. Therefore, a zero-gradient (Neumann) boundary condition is applied at the membrane outlet,
which assumes that the membrane is connected to an external domain that is not explicitly modeled. This allows the outlet concentration to be determined by the coupled diffusion–reaction processes within the membrane. A zero-gradient boundary condition is approximated by assuming negligible concentration difference between the last two control volumes.
Solving approach
The governing equation was discretized in space using the finite volume method (see the code bellow) and the resulting system of ordinary differential equations was solved using a standard ODE solver (ode45).
4. Results and Discussion
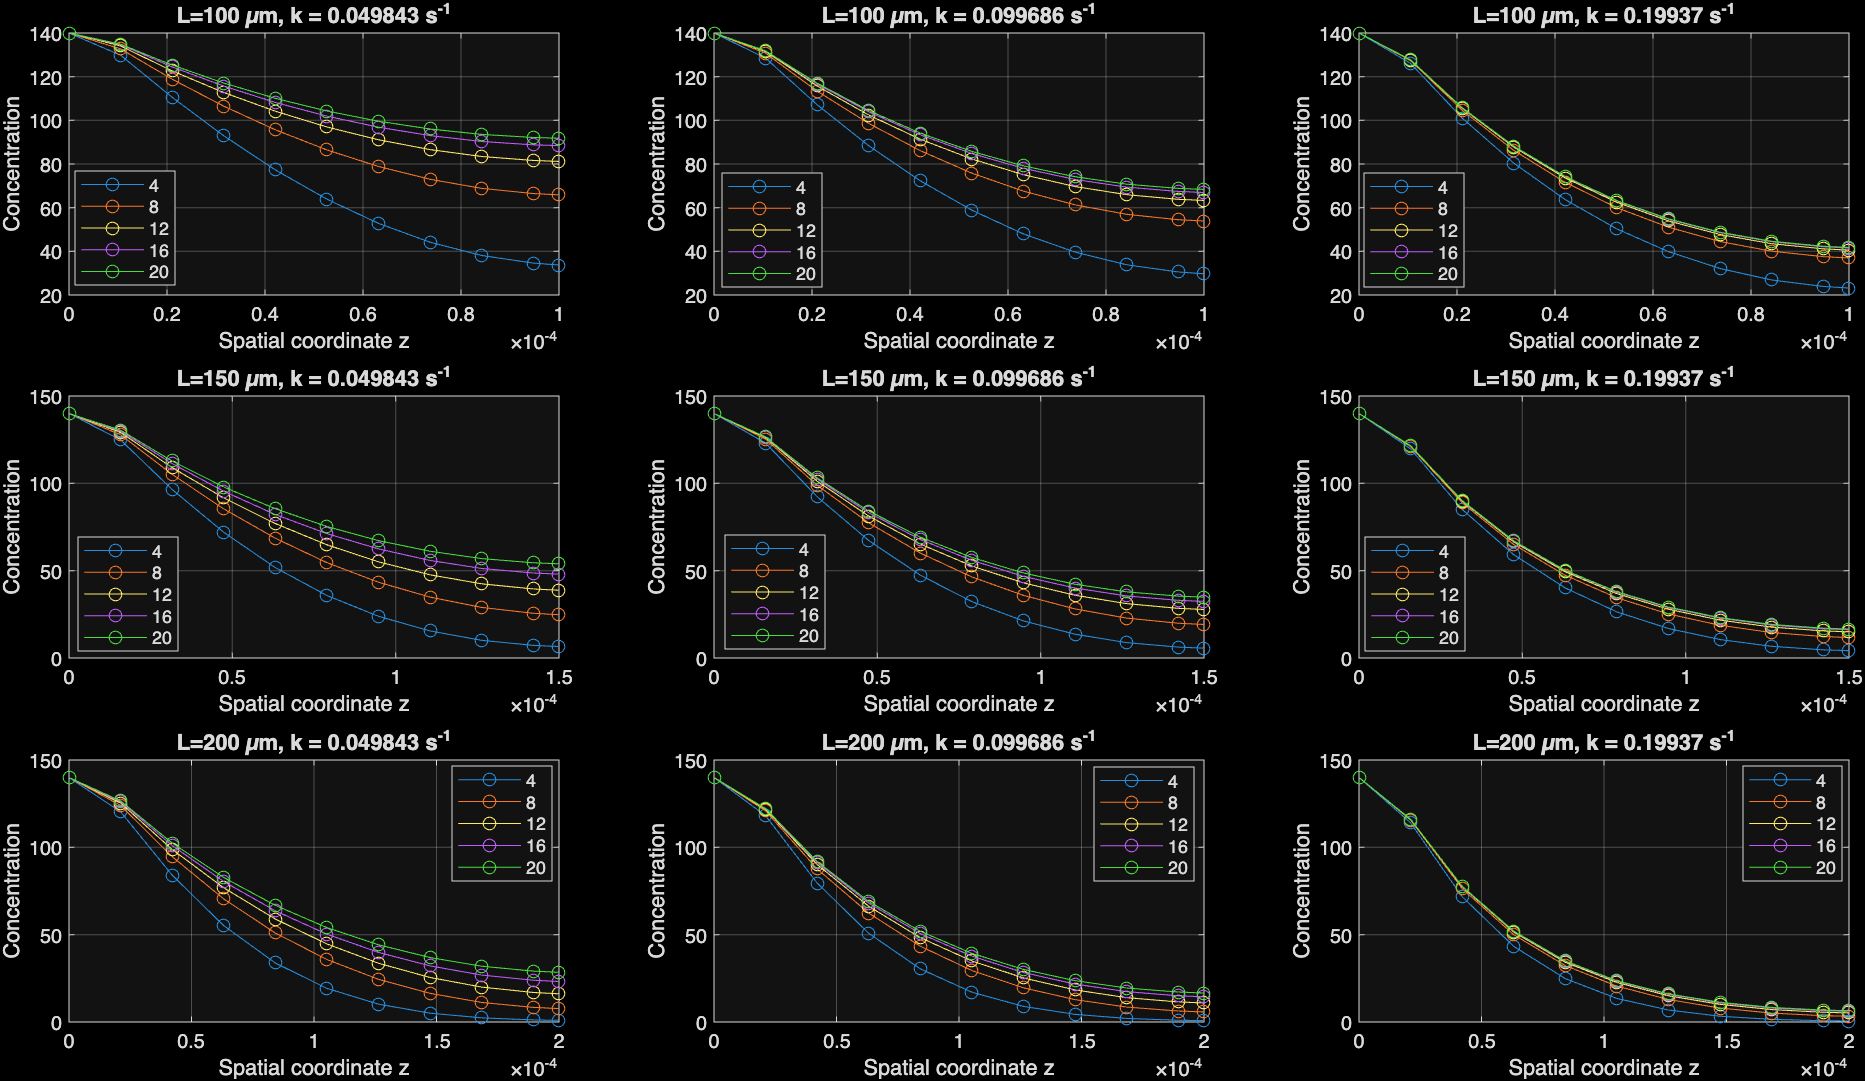
The system was examined for three different membrane thicknesses ( µm) and three different reaction rate constants (, , ).
At the length µm at , the achieved conversion was 34 %. Increasing the rate constant by the factor of 2, while the membrane length remains constant, yields conversion of 56 %. However, if the rate constant remains unchanged () and the membrane length is increased by 50 µm (one half of the original length), the conversion is 61 %, which is very similar.
Interestingly, this phenomena is observed also if the membrane length is increased from 150 µm to 200 µm (one third of the original length), the conversion becomes 80 %. Keeping the same length (150 µm), but increasing the rate constant to , the conversion becomes 75 %, which is almost identical.
The very same conversion is achieved, if membrane length is 200 µm and rate constant equals to , or the membrane length is 150 µm and reaction rate equals to .
For this setup, either increasing the reaction rate constant by the factor of 2 or increasing the membrane length by 50 µm yields very similar conversion. Conversions achieved for every combination of and are summarized in Table 1.
Table 1: Conversion achieved in each set-up.
| μm | 34 % | 56 % | 70 % |
| μm | 61 % | 75 % | 88 % |
| μm | 80 % | 88 % | 95 % |
Figure 1: Time evolution for each set-up.
5. Conclusion
In conclusion, the removal of lactose from milk was successfully modeled. The effect of reaction rate constant and membrane length on conversion was evaluated. An interesting phenomena for this specific set-up was observed: increasing the reaction rate constant by the factor of 2 achieves almost identical conversion as increasing the membrane length by 50 µm.
6. Code
Main
clear, close all, clc

% Main part of the project, where parameters may be altered. Initial
% conditions are set here and also the graphs are plotted here.

%Parameters
D25 = 0.541e-9;    % m2/s
cE = 0.05994e-1;   % kg/m3 (calculated, based on literature)
VMAX = 1397;       % mM/s/kg (taken from literature)
KM = 0.840;        % mM (taken from literature)
L_membr = 150e-6;  % m
cA0 = 140;         % mol/m3
k = VMAX/KM*cE*1e-2; % mM/s/kg/mM*kg/m3 = 1/s/m3

pars = [D25,cE,VMAX,KM,L_membr,cA0, k];

L_coef = 50e-6;       % m, absolute length of which it will be thinner or thicker
k_factor = [1/2, 1, 2]; % multiplyer of the reaction constant, for graph title
k_vec = [1/2*k, 1*k, 2*k]; % multiplyer of the reaction constant

L_vec = [L_membr-L_coef, L_membr, L_membr+L_coef];

% Number of finite volumes
N = 10;

% Initial condition
c0 = zeros(N,1); % c(z,0) = 0

% Integration of ODEs
tend = 20;
ntimes = 5;
tspan = linspace(0,tend,ntimes+1);

figure

plot_index = 1;

for p = 1:length(L_vec)
    for q = 1:length(k_vec)

        pars_mod = pars;
        pars_mod(5) = L_vec(p);
        pars_mod(7) = k_vec(q);

        [tt,yy] = ode45( @(t,y) model_project(t,y,pars_mod), tspan, c0);

        % Plot concentration profiles
        dL = L_vec(p)/(N-0.5);
        x = zeros(1,N);
        subplot(3,3,plot_index)
        for i =1:N
            x(i) = (i-1)*dL;
        end

        for j=2:ntimes+1
            plot([x L_vec(p)],[cA0, yy(j,:)], 'o-')
            hold on
        end

        title(['L=',num2str(L_vec(p)*1e6),' µm, k = ', num2str(k_vec(q)), ' s^{-1}'])
        legend(string(tt(2:end)))
        hold off
        grid on
        xlabel('Spatial coordinate z')
        ylabel('Concentration')

        plot_index = plot_index + 1;
    end
end
Function
function [dydt] = model_project(t,y,pars)

% Model of coupled diffusion-reaction. Lactose penetrates through porous PES
% membrane where an enzyme lactase is embedded. Lactose is being broken
% down to glucose and galactose. The concentration of lactose is modeled.

% Unpack parameters
D25 = pars(1);    % m2/s
cE = pars(2);      % kg/m3
VMAX = pars(3);    % mM/s/kg
KM = pars(4);        % mM
L_membr = pars(5);  % m
cA0 = pars(6);      % mol/m3
k = pars(7);   % volumetric reaction rate constant, 1/s/m3

%Unpack state variables
N = length(y);
c = y;

%% 1) Discretization & geometry
% Discretization
dL = L_membr/(N-0.5);
L = zeros(N+1,1);
L(1) = 0;
for i = 2:N+1
    L(i) = (i-1.5)*dL;
end

% Surface areas between FVs
A = zeros(N+1,1);
for i=1:N+1
    A(i) = 0.5; %m2 (area of membrane taken from literature)
end

% Volumes of FVs
V = zeros(N,1);
for i = 1:N
    V(i) = A(i)*(L(i+1)-L(i));
end

%% 2) Fluxes across FV boundaries
j = zeros(N+1,1);
% Start (left side)
j(1) = -D25*(c(1)-cA0)/(dL/2);
% the middle
for i=2:N
    j(i) = -D25*(c(i)-c(i-1))/dL;
end
% End (right side)
j(N+1) = -D25*(c(N-1) - c(N))/(dL/2);

%% 3) Balance of Finite volumes
dcdt = zeros(N,1);
for i=1:N
    dcdt(i) = j(i)*A(i) - j(i+1)*A(i+1) -k*c(i)*V(i);
    dcdt(i) = dcdt(i)/V(i);
end

% Send a column vector
dydt = dcdt;